 CircosHeatmap-aardio
A Circular Heatmap Visualization Tool Based on R Language
📃 Project Introduction
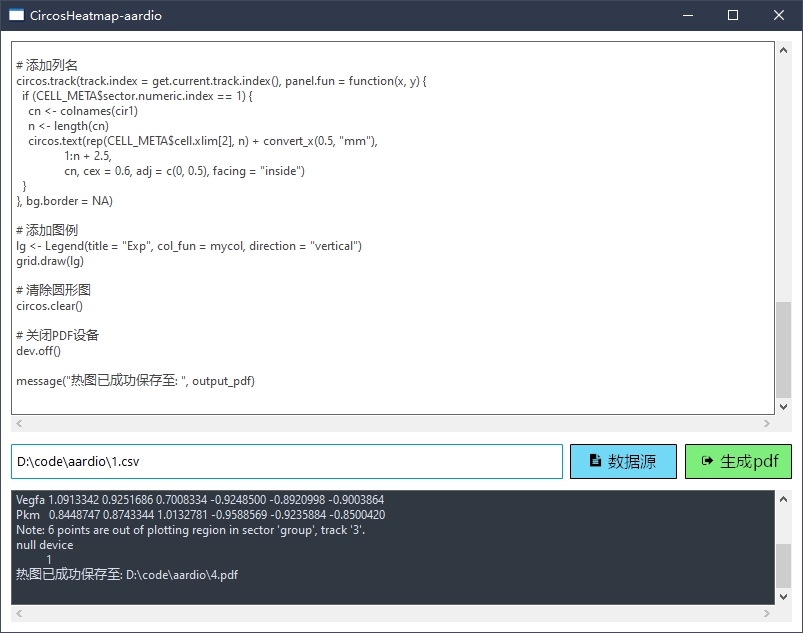
CircosHeatmap-aardio is a circular heatmap (Circos Heatmap) visualization tool based on R language. It supports clustering and visualization of matrix data. Through the Aardio graphical interface, users can easily use the tool without writing any code.
✨ Core Features
- Circular Heatmap Visualization: Based on R's
circlizeandComplexHeatmappackages, it supports clustering and visualization of matrix data. - Graphical Interface: Implemented with Aardio, allowing users to select input files, set parameters, and run scripts through the interface.
- Code Visualization and Debugging: Built-in R code editor for viewing and modifying the current R script.
- Log Output: Provides a log window to display script execution results and error messages.
🚀 Quick Start
1. Download and Extract
Download and extract CircosHeatmap-aardio from Releases.
2. Run the Program
Run CircosHeatmap-aardio.exe. The R environment will be automatically installed on the first run.
3. Select Data Source
Click "Data Source" to select a csv file.
Note
: Currently, only csv format is supported. If your data is in other formats (e.g., xls, xlsx), convert it to csv before use.
4. Generate PDF
Click "Generate PDF" to select the save location.
🛠️ Program Details
Interface Layout
- R Code Editor: Displays the current R script for viewing and modification.
- Log Window: Shows script execution results and error messages in real-time.
- Data Source Selection: Select input files via button (supports csv format).
- Generate PDF: Run the R script and save the generated circular heatmap as a PDF file.
Code Logic
- R Script Loading: The default R script (
heatmap_script.R) is loaded on program startup. - File Selection: Click "Data Source" to select an input file, and the path is displayed in the input box.
- Script Execution: Click "Generate PDF" to execute the R script with the input file path and output PDF path.
📝 TODO
- UI Improvements: Enhance user interaction and experience.
- Support More File Formats: Extend support for xls, xlsx, etc.
- Advanced Features: Add features like custom color gradients and clustering parameter adjustments.
✨ Contributions
Contributions, suggestions, bug reports, and fixes are welcome! If you have any ideas or questions, please submit an Issue or Pull Request.
❓ Pull Request Guide
Pull Request (PR) is a way to contribute code to the project. Follow these steps:
- Fork the Project: Click the
Forkbutton on the project page to create a copy under your account. - Create a Branch: Create a new branch in your forked repository for developing new features or fixing issues.
- Commit Changes: Make your changes in the new branch and commit them.
- Submit a Pull Request: On your forked repository page, click
New Pull Request, select your branch, and submit the PR. - Wait for Review: The project maintainer will review your code and merge it into the main branch if everything is OK.

